• Home
  • Experiences
  • Contact
  • Blog
← Back to Blog
Subway-map style illustration of the Biobank Intro Series showing the journey through UK Biobank and All of Us topics.
Think of this as your subway map: each stop in this blog series builds the foundation you need before diving into biobank analysis.

Biobank Intro Series

3 parts

Iceberg diagram illustrating hidden complexities in biobank data: visible raw data above the waterline, and three categories of hidden challenges below: batch effects, population stratification, and inaccurate phenotype data.

Biobank Intro Series: Getting Started

February 23, 2025

How to do biobank analysis without losing your mind

Read
Two islands labeled "Your Workspace" and "Data Storage" are connected by a tiny, rickety wooden footbridge. Crossing the bridge is a terminal carrying a folder.

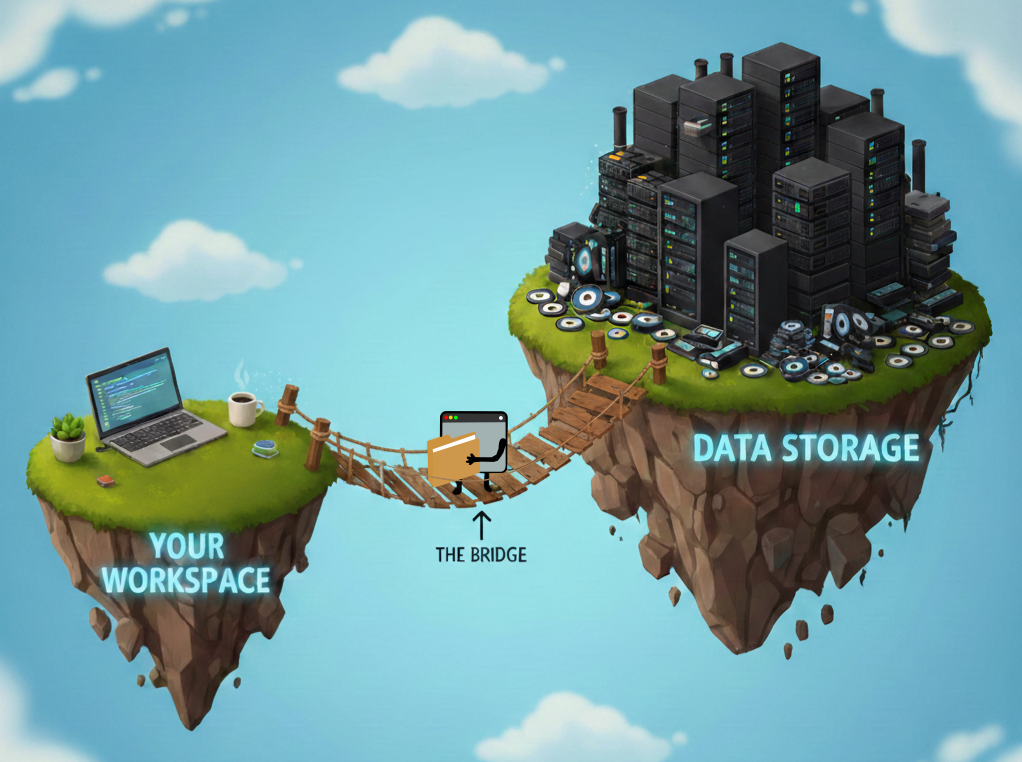
Biobank Intro Series: Hardware Settings

March 2, 2026

Hardware setup lessons for UK Biobank Research Analysis Platform and All of Us Workbench

Read
Papers tell you WHAT was used. Showcase tells you what's AVAILABLE NOW.

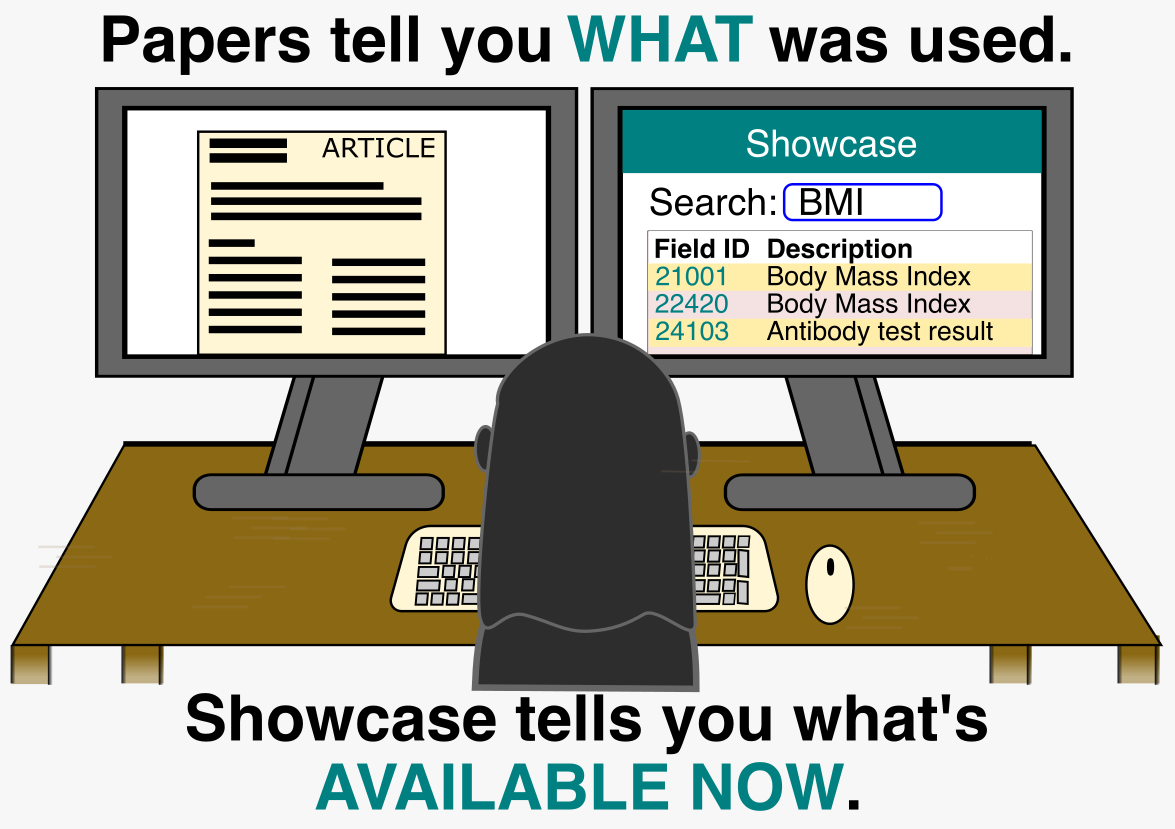
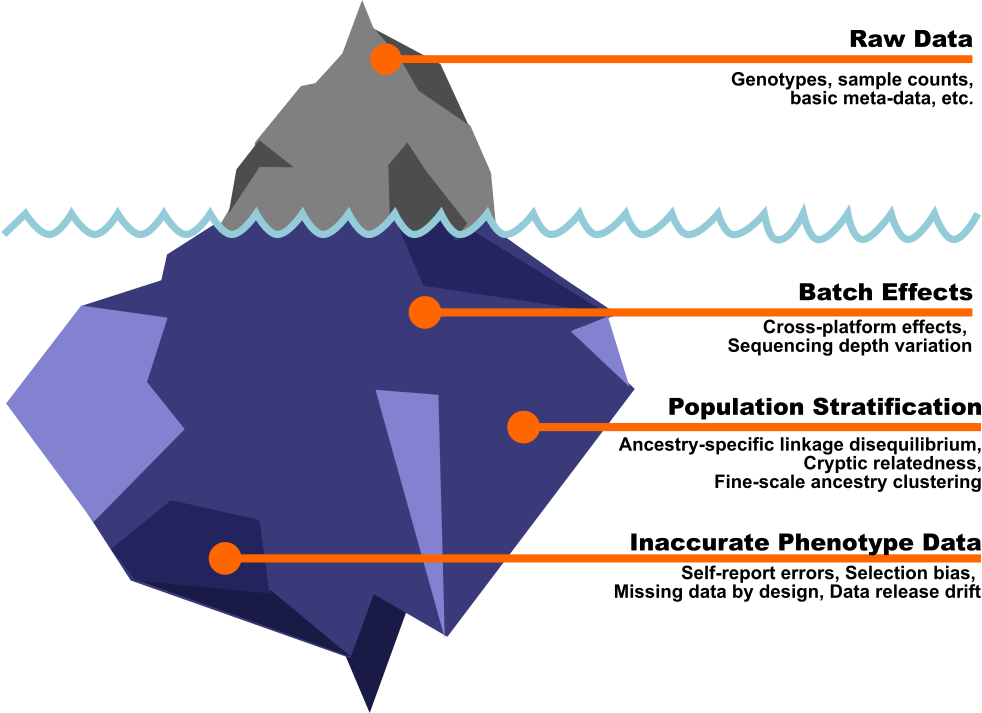
Biobank Intro Series: UK Biobank Observational Data (Part I)

March 9, 2026

An ode to the UK Biobank Showcase

Read
Contact Source Code

© 2026 Samantha Klasfeld. All rights reserved.